| Oracle7 Server Tuning | Library |
Product |
Contents |
Index |
| Oracle7 Server Tuning | Library |
Product |
Contents |
Index |
See Also: Appendix C, "Parallel Query Concepts", to understand the basic principles of parallel query processing.
The three basic steps for tuning the parallel query are outlined in the following sections.
Before starting the Oracle Server, set the following initialization parameters. The recommended settings are guidelines for a large data warehouse (more than 100 gigabytes) on a typical high-end shared memory multiprocessor with one or two gigabytes of memory. Each section explains how to modify these settings for other configurations. Note that you can change some of these parameters dynamically with ALTER SYSTEM or ALTER SESSION statements. The parameters are grouped as follows:
As a general guideline for memory sizing, note that each process needs address space big enough for its hash joins. A dominant factor in heavyweight decision support (DSS) queries is the relationship between memory, number of processes, and number of hash join operations. Since hash joins and large sorts are memory hungry operations, you may want to configure fewer processes, each with a greater limit on the amount of memory it can use.
Memory available for DSS queries comes from process memory, which in turn comes from virtual memory. Total virtual memory should be somewhat more than available real memory, which is the physical memory minus the size of the SGA.
The SGA is static, of fixed size. Typically it comes out of the real physical memory. If you want to change the size of the SGA you must shut down the database, make the change, and restart the database. DSS memory is much more dynamic. It comes out of process memory: and both the size of a process' memory and the number of processes can vary greatly.
Virtual memory is typically more than physical memory, but should not generally exceed twice the size of the physical memory less the SGA size. If you make it many times more than real memory, the paging rate may go up when the machine is overloaded at peak times.
Tune the following parameters to ensure that resource consumption is optimized for your parallel query needs.
Attention: "Understanding Parallel Query Performance Issues" on page 18-26 describes in detail how these parameters interrelate, and provides a formula to help you balance their values.
This parameter provides for adequate memory for hash joins. Each process that performs a parallel hash join uses an amount of memory equal to HASH_AREA_SIZE.
Hash join performance is more sensitive to HASH_AREA_SIZE than sort performance is to SORT_AREA_SIZE. As with SORT_AREA_SIZE, too large a hash area may cause the system to run out of memory.
The hash area does not cache blocks in the buffer cache; even low values of HASH_AREA_SIZE will not cause this to occur. Too small a setting could, however, affect performance.
See Also: "SORT_AREA_SIZE" on page 18-9
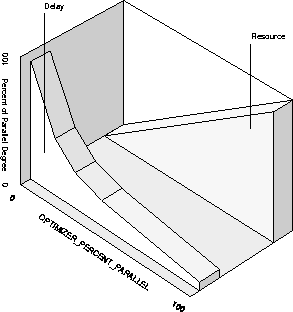
Note: Selecting a single record from a table, if there is an appropriate index, can be done very quickly and does not require parallelism. A full scan to find the single row can be executed in parallel. Normally, however, each parallel process examines many rows. In this case response time of a parallel plan will be higher and total system resource use would be much greater than if it were done by a serial plan using an index. With a parallel plan, the delay is shortened because more resource is used. The parallel plan could use up to D times more resource, where D is the degree of parallelism. A value between 0 and 100 sets an intermediate trade-off between throughput and response time. Low values favor indexes; high values favor table scans.
A FIRST_ROWS hint or optimizer mode will override a non-zero setting of OPTIMIZER_PERCENT_PARALLEL.
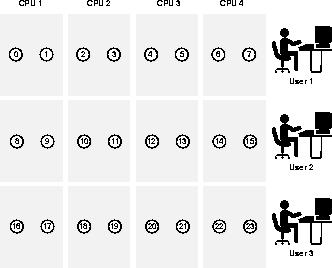
PARALLEL_MIN_SERVERS=n
where n is the number of processes you want to start and reserve for parallel query operations. Sometimes you may not be able to increase the maximum number of query servers for an instance because the maximum number depends on the capacity of the CPUs and the I/O bandwidth (platform-specific issues). However, if servers are continuously starting and shutting down, you should consider increasing the value of the parameter PARALLEL_MIN_SERVERS.
For example, if you have determined that the maximum number of concurrent query servers that your machine can manage is 100, you should set PARALLEL_MAX_SERVERS to 100. Next determine how many query servers the average query needs, and how many queries are likely to be executed concurrently. For this example, assume you will have two concurrent queries with 20 as the average degree of parallelism. At any given time, there could be 80 query servers busy on an instance. You should therefore set the parameter PARALLEL_MIN_SERVERS to 80.
Consider decreasing PARALLEL_MIN_SERVERS if fewer query servers than this value are typically busy at any given time. Idle query servers constitute unnecessary system overhead.
Consider increasing PARALLEL_MIN_SERVERS if more query servers than this value are typically active, and the "Servers Started" statistic of V$PQ_SYSSTAT is continuously growing.
Increase the initial value of this parameter to provide space for a pool of message buffers that parallel query servers can use to communicate with each other. As illustrated in the following figure, assuming 4 concurrent users and 2K buffer size, you would increase SHARED_POOL_SIZE by 6K * (CPUs + 2) * PARALLEL_MAX_SERVERS for a pool of message buffers that parallel query servers use to communicate. This value grows quadratically with the degree of parallelism.
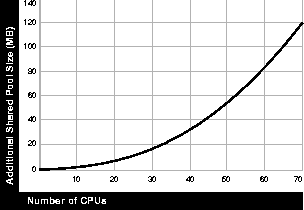
On Oracle Parallel Server, there can be multiple CPUs in a single node, and parallel query can be performed across nodes. Whereas SMP systems use 3 buffers for connection, 4 buffers are used to connect between instances on Oracle Parallel Server. Thus you should normally have 4 buffers in shared memory: 2 in the local shared pool and 2 in the remote shared pool. The formula for increasing the value of SHARED_POOL_SIZE on OPS becomes:
(4 * msgbuffer_size) * ((CPUs_per_node * #nodes ) + 2) * (PARALLEL_MAX_SERVERS * #nodes)
Note that the degree of parallelism on OPS is expressed by the number of CPUs per node multiplied by the number of nodes.
If the sort area is too small, an excessive amount of I/O will be required to merge a large number of runs. If the sort area size is smaller than the amount of data to sort, then the sort will spill to disk, creating sort runs. These must then be merged again using the sort area. If the sort area size is very small, there will be many runs to merge, and it may take multiple passes to merge them together. The amount of I/O increases as the sort area size decreases.
If the sort area is too high the operating system paging rate will be excessive. The cumulative sort area adds up fast because each parallel query server can allocate this amount of memory for each sort. Monitor the operating system paging rate to see if too much memory is being requested.
See Also: "HASH_AREA_SIZE" on page 18-4

Alternatively, the SQL NOT IN predicate can be evaluated using an anti-join to subtract two sets. Thus emp.deptno can be anti-joined to dept.deptno to select all employees who are not in a set of departments. Thus you can get a list of all employees who are not in the Shipping or Receiving departments.
For example, direct read for table scans and sorts was introduced in release 7.1.5. This feature greatly speeds up table scans on SMP platforms. If not set, all reads will go through the buffer cache. Similarly, temporary tablespaces, introduced in release 7.3, improve efficiency of sort and hash joins.
Note: Make a full backup before you change the value of this parameter.
See Also: Oracle Server Concepts
In general, use the formula:
Because memory for I/O buffers comes from the HASH_AREA_SIZE, larger I/O buffers mean fewer hash buckets. There is a trade-off, however. For large tables (hundreds of gigabytes in size) it is better to have more hash buckets and slightly less efficient I/Os. If you find an I/O bound condition on temporary space during hash join, consider increasing this value.
Serial and parallel queries which involve serial table scans (but not parallel table scans), and all index lookups, use the buffer cache for both the index and the table which the index references. Sorts will use the buffer cache if SORT_DIRECT_WRITES is FALSE or set to AUTO, but the SORT_AREA_SIZE is small. INSERT, UPDATE, and DELETE statements also use the buffer cache. By contrast, CREATE INDEX and CREATE TABLE AS SELECT statements do not use the buffer cache.
If paging is high, it is a symptom that the relationship of memory, users, and query servers is out of balance. To rebalance it, you can reduce the sort or hash area size. You can limit the amount of memory for sorts if SORT_DIRECT_WRITES is set to AUTO but the SORT_AREA_SIZE is small. Then sort blocks will be cached in the buffer cache. Note that SORT_DIRECT_WRITES has no effect on hashing.
See Also: "HASH_AREA_SIZE" on page 18-4
"The Formula for Memory, Users, and Query Servers" on page 18-26
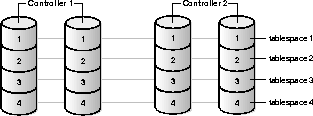
The operating system or volume manager can perform striping (OS striping), or you can manually perform striping for parallel operations.
Good stripe sizes for table data are 128K, 256K, 1MB, and 5MB, depending on block size and size of the data object. For example, with a medium size database (perhaps 20G), 1MB is a good stripe size. On a very large database (over 100G), 5BM tends to be the best stripe size. These recommended sizes represent a compromise between the requirements of query performance, backup and restore performance, and load balancing. Setting the stripe size too small will detract from performance, particularly for backup and restore operations.
See Also: For MPP systems, see your platform-specific Oracle documentation regarding the advisability of disabling disk affinity when using operating system striping.
For manual striping add multiple files, each on a separate disk, to each tablespace.
Often, the same OS subsystem that provides striping also provides mirroring. With the declining price of disks, mirroring can provide an effective alternative solution to backups and log archival. Disaster recovery is still an issue, however. Even cheaper than mirroring is RAID technology, which avoids full duplication in favor of more expensive write operations. For read-mostly applications, this may suffice.
Note: RAID5 technology is particularly slow on write operations. This may affect your database restore time to a point that RAID5 performance is unacceptable.
See Also: For a discussion of manually striping tables across datafiles, refer to "Striping Disks" on page 14-23.
For a discussion of media recovery issues, see "Backup and Recovery of the Data Warehouse" on page 6-8.
Here, each partition is spread across one third of the disks in the tablespace so that loss of a single disk causes 4 out of 12 partitions to become unavailable.
Alternatively, partitions may be assigned to disks such that a disk failure takes out a single partition, and surviving partitions remain available. The trade-off is that queries against a single partition may not scale due to the limited I/O bandwidth of two or three disks.
For best performance with Oracle Parallel Server, the physical layout of individual partitions should be optimized such that each is scanned in parallel, and each has the best possible I/O throughput to query servers. To avoid I/O bottlenecks when not all partitions are being scanned (because some have been eliminated), each partition should be spread over a number of devices. Furthermore, on parallel server systems, those devices should be spread over multiple nodes.
See Also: Chapter 11, "Managing Partition Views"
Your operating system specific Oracle documentation.
Should you find that some operations are I/O bound with the default parallelism, and you have more disks than CPUs, override the usual parallelism with a hint that increases parallelism up to the number of disks, or until the CPUs become saturated.
Common I/O bound operations are:
			CREATE TABLESPACE TSfacts
				DATAFILE '/dev/D1' SIZE 4096MB REUSE
				DEFAULT STORAGE (INITIAL 64K NEXT 100MB PCTINCREASE 0);
Extent sizes should be multiples of the multiblock read size, where
blocksize * MULTIBLOCK_READ_COUNT = multiblock read size
Note in particular the following aspects of our approach:
Each loader process can typically load between 1 and 2 gigabytes per hour. Since we have 10 CPUs, we will use parallel degree 10.
Note: It is not desirable to allocate extents faster than about 2 or 3 per minute. See the "ST Enqueue" on page 18-34 for more information.
Create as many datafiles as the degree of parallelism you will use for creating and loading objects in the tablespace. This reduces fragmentation and consequent waste of space in the tablespace. Create multiple datafiles even if you are using OS stripes.
We run the following commands concurrently as background processes:
		ALTER TABLESPACE TSfacts ADD DATAFILE '/dev/D2' SIZE 4096MB REUSE
		ALTER TABLESPACE TSfacts ADD DATAFILE '/dev/D3' SIZE 4096MB REUSE
		...
		ALTER TABLESPACE TSfacts ADD DATAFILE '/dev/D30' SIZE 4096MB REUSE
			CREATE TABLE fact_1 (dim_1 NUMBER, dim_2 DATE, ...
				meas_1 NUMBER, meas_2 NUMBER, ... )TABLESPACE TSfacts PARALLEL;
			CREATE TABLE fact_2 (dim_1 NUMBER, dim_2 DATE,
				meas_1 NUMBER, meas_2 NUMBER, ... ) TABLESPACE TSfacts PARALLEL;
			. . .
			CREATE TABLE fact_12 (dim_1 NUMBER, dim_2 DATE, ...
				meas_1 NUMBER, meas_2 NUMBER, ... )
			 TABLESPACE TSfacts PARALLEL;
			CREATE OR REPLACE VIEW facts AS  SELECT * FROM fact_1 UNION ALL

				SELECT * FROM fact_2 UNION ALL ...
				SELECT * FROM fact_12;
			SQLLDR DATA=fact_1.file_1 DIRECT=TRUE PARALLEL=TRUE
				FILE=/dev/D1
			...
			SQLLDR DATA=fact_1.file_10 DIRECT=TRUE PARALLEL=TRUE
				FILE=/dev/D10
			WAIT;
			...
			SQLLDR DATA=fact_12.file_1 DIRECT=TRUE PARALLEL=TRUE
				FILE=/dev/D21
			SQLLDR DATA=fact_12.file_10 DIRECT=TRUE PARALLEL=TRUE
				FILE=/dev/D30
For Oracle Parallel Server, divide the loader session evenly among the nodes. The data file being read should always reside on the same node as the loader session. NFS mount of the data file on a remote node is not an optimal approach.
Note: Although this example shows parallel load used with partition views, the two features can be used independent of one another.
We run the following commands concurrently in the background.
			ALTER TABLE fact_1 ADD CONSTRAINT month_1
				CHECK (dim_2 BETWEEN `01-01-1995' AND `01-31-1995')
			...
			ALTER TABLE fact_12 ADD CONSTRAINT month_12
				CHECK (dim_2 BETWEEN `12-01-1995' AND `12-31-1995')
CREATE TABLESPACE TStemp TEMPORARY DATAFILE '/dev/D31'
	SIZE 4096MB REUSE
DEFAULT STORAGE (INITIAL 10MB NEXT 10MB PCTINCREASE 0);
Temporary extents should be smaller than permanent extents because there are more demands for temporary space, and parallel processes or other queries running concurrently must share the temporary tablespace. Once you allocate an extent it is yours for the duration of your operation. If you allocate a large extent but only need to use a small amount of space, the unused space in the extent is tied up.
At the same time, temporary extents should be large enough that processes do not have to spend all their time waiting for space. Although temporary tablespaces use less overhead than permanent tablespaces when allocating and freeing a new extent, obtaining a new temporary extent is not completely free of overhead.
ALTER DATABASE DATAFILE `/dev/D50' RESIZE 1K;
ALTER DATABASE DATAFILE `/dev/D50' OFFLINE;
Because the dictionary sees the size as 1K, which is less than the extent size, the bad file will never be accessed. Eventually, you may wish to recreate the tablespace because Oracle allows a maximum of 1022 files in the database.
Be sure to make your temporary tablespace available for use:
ALTER USER scott TEMPORARY TABLESPACE TStemp;
See Also: For MPP systems, see your platform-specific documentation regarding the advisability of disabling disk affinity when using operating system striping.
Create at least as many files in the tablespace as the degree of parallelism used to create indexes in the tablespace. This will reduce fragmentation.
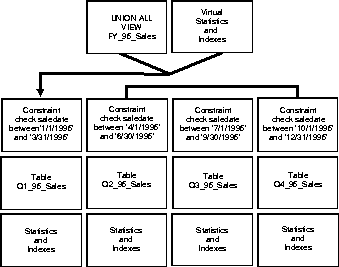
Because we used partition views, we must create indexes on each partition. Our options are summarized in the following table:
If OS striping is used, we can choose to create indexes one at a time using parallel index creation for each one. Creating all indexes concurrently in parallel would probably overload the capacity of the machine. If Oracle striping is used, we should use parallel index creation for each index so that each index is spread over many disks for high I/O bandwidth (unless partial availability after media failure is the primary goal). To do this we enter:
CREATE TABLESPACE TSidx DATAFILE 'dev/D51' SIZE 4096M
	DEFAULT STORAGE (INITIAL 40MB NEXT 40MB PCTINCREASE 0);
CREATE INDEX I1 ON fact_1(dim_1, dim_2, dim_3)
	TABLESPACE TSidx PARALLEL UNRECOVERABLE;
CREATE INDEX I2 ON fact_2(dim_1, dim_2, dim_3)
	TABLESPACE TSidx PARALLEL UNRECOVERABLE;
...
CREATE INDEX I12 ON fact_12(dim_1, dim_2, dim_3)
	TABLESPACE TSidx PARALLEL UNRECOVERABLE;
Note: Cost-based optimization is always used with parallel query and with partition views. You must therefore perform ANALYZE at the partition level with partitioned tables and with parallel query
Queries with many joins are quite sensitive to the accuracy of the statistics. Use the COMPUTE option of the ANALYZE command if possible (it may take quite some time and a large amount of temporary space). If you must use the ESTIMATE option, sample as large a percentage as possible. Use histograms for data which is not uniformly distributed. Note that a great deal of data falls into this classification.
When you analyze a table, the indexes that are defined on that table are also analyzed. To analyze all partitions of facts (including indexes) in parallel, run the following commands concurrently as background processes:
ANALYZE TABLE fact_1 COMPUTE STATISTICS
ANALYZE TABLE fact_2 COMPUTE STATISTICS
...
ANALYZE TABLE fact_12 COMPUTE STATISTICS
It is worthwhile computing or estimating with a larger sample size the indexed columns and indexes themselves, rather than the measure data. The measure data is not used as much: most of the predicates and critical optimizer information comes from the dimensions. A DBA or application designer should know which columns are the most frequently used in predicates.
For example, you might analyze the data in two passes. In the first pass you could obtain some statistics by analyzing one percent of the data. Run the following commands concurrently as background processes:
ANALYZE TABLE fact_1 ESTIMATE STATISTICS SAMPLE 1 PERCENT
ANALYZE TABLE fact_2 ESTIMATE STATISTICS SAMPLE 1 PERCENT
...
ANALYZE TABLE fact_12 ESTIMATE STATISTICS SAMPLE 1 PERCENT
In a second pass, you could refine statistics for the indexed columns and the index (but not the non-indexed columns):
ANALYZE TABLE fact_1 COMPUTE STATISTICS FOR ALL INDEXED COLUMNS SIZE 1
ANALYZE TABLE fact_1 COMPUTE STATISTICS FOR ALL INDEXES
ANALYZE TABLE fact_2 COMPUTE STATISTICS FOR ALL INDEXED COLUMNS SIZE 1
ANALYZE TABLE fact_2 COMPUTE STATISTICS FOR ALL INDEXES
...
ANALYZE TABLE fact_12 COMPUTE STATISTICS FOR ALL INDEXED COLUMNS SIZE 1
ANALYZE TABLE fact_12 COMPUTE STATISTICS FOR ALL INDEXES
The result will be a faster plan because you have targeted more important information. You are spending more resources to get good statistics on high value columns (indexes and join columns), and getting baseline statistics for the rest of the data.
In considering the maximum number of processes a system can support, it is useful to divide the processes into three classes, based on their memory requirements. The maximum number of processes which can fit in memory can then be analyzed as follows:
+ (# low memory processes * low memory required)
See Also: "Optimizing Join Statements" on page A-37 for a comparison of hash joins and sort merge joins.
Your system may be able to perform acceptably even if oversubscribed by 60%, if on average not all of the processes are performing hash joins concurrently. Users might then try to use more than the available memory, so you must monitor paging activity in such a situation. If paging goes up dramatically, consider another alternative.
On average, no more than 5% of the time should be spent simply waiting in the operating system on page faults. To spend more wait time than this indicates an I/O bound condition of the paging subsystem. Use your operating system monitor to check wait time: The sum of time waiting and time running equals 100%. If you are running close to 100% CPU, then you are not waiting. If you are waiting, it should not be on account of paging.
If wait time for paging devices exceeds 5%, it is a strong indication that you must reduce memory requirements. This could mean reducing the memory required for each class of process, or reducing the number of processes in memory-intensive classes. It could mean adding memory. Or it could indicate an I/O bottleneck in the paging subsystem that you could resolve by striping.
Note: You must verify that a particular degree of oversubscription will be viable on your system by monitoring the paging rate and making sure you are not spending more than a very small percent of the time waiting for the paging subsystem.
You can limit the parallel pool by reducing the value of PARALLEL_MAX_SERVERS. This places a system-level limit on the total amount of parallelism, and is easy to administer. More processes will then be forced to run in serial mode.
Scheduling Parallel Jobs. Rather than reducing parallelism for all operations, you may be able to schedule large parallel batch jobs to run with full parallelism one at a time, rather than concurrently. Queries at the head of the queue would have a fast response time, those at the end of the queue would have a slow response time. Queueing jobs is thus another way to reduce the number of processes but not reduce parallelism; its disadvantage, however, is a certain amount of administrative overhead.
If every query performs a hash join and a sort, the high memory requirement limits the number of processes you can have. To allow more users to run concurrently you may need to reduce the DSS process memory.
Moving Processes from High to Medium Memory Requirements. You can move a process from the high-memory class to moderate-memory by changing from hash join to merge join. You can use initialization parameters to limit available memory and thus force the optimizer to stay within certain bounds.
You can disable the hash join capability and explicitly enable it for important hash joins you want to run in batch. On a per-instance basis you could set HASH_JOIN_ENABLED to false, and set it to true only on a per-session basis. Conversely, you could set HASH_JOIN_ENABLED to true on a per-instance basis, and make it false for particular sessions.
Alternatively, you can reduce HASH_AREA_SIZE to well below the recommended minimum (for example, to 1-2MB). Then you can let the optimizer choose sort merge join more often (as opposed to telling the optimizer never to use hash joins). In this way, hash join can still be used for small tables: the optimizer has a memory budget within which it can make decisions about which join method to use.
Remember that the recommended parameter values provide the best response time. If you severely limit these values you may see a significant affect on response time.
Moving Processes from High or Medium Memory Requirements to Low Memory Requirements. If you need to support thousands of users, you must create access paths such that queries do not touch much data. Decrease the demand for index joins by creating indexes and/or summary tables. Decrease the demand for GROUP BY sorting by creating summary tables and encouraging users and applications to reference summaries rather than detailed data. Decrease the demand for ORDER BY sorts by creating indexes on frequently sorted columns.
The penalty for taking such an approach is that when a single query happens to be running, the system will use just half the CPU resource of the 10 CPU machine. The other half will be idle until another query is started.
To determine whether your system is being fully utilized, you can use one of the graphical system monitors which are available on most operating systems. These monitors often give you a better idea of CPU utilization and system performance than monitoring the execution time of a query. Consult your operating system documentation to determine whether your system supports graphical system monitors.
To server more users, you can drastically reduce hash area size to 2MB. You may then find that the optimizer switches some queries to sort merge join. This configuration can support 17 parallel queries, or 170 serial queries, but response times may be significantly higher than if you were using hash joins.
Notice the trade-off above: by reducing memory per process by a factor of 16, you can increase the number of concurrent users by a factor of 16. Thus the amount of physical memory on the machine imposes another limit on total number of parallel queries you can run involving hash joins and sorts.
You might take 20 query servers, and set HASH_AREA_SIZE to a midrange value, perhaps 20MB, for a single powerful batch job in the high memory class. Twenty servers multiplied by 20MB equals 400MB of memory. (This might be a big GROUP BY with join to produce a summary of data.)
You might plan for 10 analysts running sequential queries that use complex hash joins accessing a large amount of data. (You would not allow them to do parallel queries because of memory requirements.) Ten such sequential processes at 40MB apiece equals 400MB of memory.
Finally, to support hundreds of users doing low memory processes at about 0.5MB apiece, you might reserve 200MB.
You might consider it safe to oversubscribe at 50% because of the infrequent batch jobs during the day. This would give you enough virtual memory for the workload described above (700MB * 1.5 = 1.05GB).

With only 5 users doing large hash joins, each process would get over 16 MB of hash area, which would be fine. But if you want 32 MB available for lots of hash joins, the system could only support 2 or 3 users. By contrast, if users are just computing aggregates the system needs adequate sort area size--and can have many more users.
Given the organization's resources and business needs, is it reasonable for you to upgrade your system's memory? If memory upgrade is not an option, then you must change your expectations. To adjust the balance you might:
Use dedicated temporary tablespaces to optimize space management for sorts. This is particularly beneficial on a parallel server. You can monitor this using V$SORT_SEGMENT.
Set initial and next extent size to a value in the range of 1MB to 10MB. Processes may use temporary space at a rate of up to 1MB per second. Do not accept the default value of 40K for next extent size, because this will result in many requests for space per second.
If you are unable to allocate extents for various reasons, you can recoalesce the space by using the ALTER TABLESPACE COALESCE SPACE command. This should be done on a regular basis for temporary tablespaces in particular.
See Also: "Setting Up Temporary Tablespaces for Parallel Sort and Hash Join" on page 18-22
To optimize the parallel query on a parallel server, you need to correctly set GC_FILES_TO_LOCKS. On a parallel server a certain number of parallel cache management (PCM) locks are assigned to each data file. DBA locking in its default behavior assigns one lock to each block. During a full table scan a PCM lock must then be acquired for each block read into the scan. To speed up full table scans, you have three possibilities:
The parallel query feature assigns each instance a unique number, which is determined by the INSTANCE_NUMBER initialization parameter. The instance number regulates the order of instance startup.
When multiple concurrent queries are running on a single node, load balancing is done by the operating system. For example, if there are 10 CPUs and 5 query servers, the operating system distributes the 5 processes among the CPUs. If a second user is added, the operating system still distributes the workload.
For a parallel server, however, no single operating system performs the load balancing: instead, the parallel query feature performs this function.
ALTER TABLE tablename PARALLEL (INSTANCES 1)
If a query requests more than one instance, allocation priorities involve table caching and disk affinity.
ALTER TABLE tablename PARALLEL (INSTANCES 2)
Thus, if there are 5 query servers, it is advantageous for them to run on as many nodes as possible.
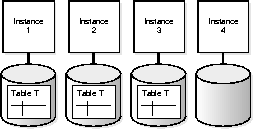
With disk affinity, Oracle tries to allocate query servers for parallel table scans on the instances which own the data. Disk affinity exploits a "shared nothing" architecture by minimizing data shipping and internode communication. It can significantly increase parallel query throughput and response time.
Disk affinity is used for parallel table scans and parallel temporary tablespace allocation, but is not used for parallel table creation or parallel index creation. Temporary tablespaces internally try to use storage that is local to an instance. It guarantees optimal space management extent allocation. Optimization is the calculation of disk affinity to achieve best performance. Operating system striping disables disk affinity.
In the following example of disk affinity, table T is distributed across 3 nodes, and a full table scan on table T is being performed.
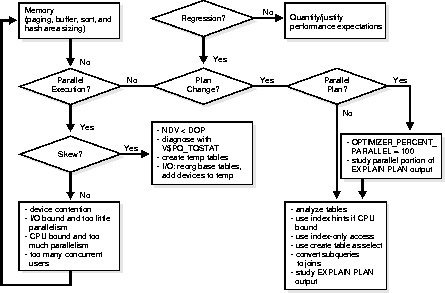
If performance is not as you expected, can you quantify the deviation? For decision support queries, the execution plan is key. For critical DSS queries, save the EXPLAIN PLAN results. Then, as you analyze the data, reanalyze, upgrade Oracle, and load in new data over the course of time, you can compare any new execution plan with the old plan. You can take this approach either proactively or reactively.
Alternatively, you may find that you get a plan that works better if you use hints. You may want to understand why hints were necessary, and figure out how to get the optimizer to generate the desired plan without the hints. Try increasing the statistical sample size: better statistics may give you a better plan. If you had to use a PARALLEL hint, look to see whether you had OPTIMIZER_PERCENT_PARALLEL set to 100%.
If the execution plan is (or should be) serial, consider the following strategies:
For DSS queries, both serial and parallel, consider memory. Check the paging rate and make sure the system is using memory as effectively as possible. Check buffer, sort, and hash area sizing.
The statistics in V$PQ_TQSTAT show rows produced and consumed per query server process. This is a good indication of skew, and does not require single user operation.
Operating system statistics show you the per-processor CPU utilization and per-disk I/O activity. Concurrently running tasks make it harder to see what is going on, however. It would be useful to run in single user mode and check operating system monitors which show system level CPU and I/O activity.
When workload distribution is unbalanced, a common culprit is the presence of skew in the data. For a hash join, this may be the case if the number of distinct values is less than the degree of parallelism. When joining two tables on a column with only 4 distinct values, you will not get scaling on more than 4. If you have 10 CPUs, 4 of them will be saturated but 6 will be idle. To avoid this problem, change the query: use temporary tables to change the join order such that all queries have more values in the join column than the number of CPUs.
If I/O problems occur you may need to reorganize your data, spreading it over more devices. If parallel execution problems occur, check to be sure you have followed the recommendation to spread data over at least as many devices as CPUs.
If there is no skew in workload distribution, check for the following conditions:
Query performance is not the only thing you must monitor. You should also monitor parallel load and parallel index creation, and look for good utilization of I/O and CPU resources.
EXPLAIN PLAN thus provides detailed information as to where specific operations are being performed. You can then change the execution plan for better performance. For example, if many steps are serial (where OTHER_TAG is blank, serial to parallel, or parallel to serial), then the query controller could be a bottleneck.
EXPLAIN PLAN SET STATEMENT_ID = `Jan_Summary' FOR
SELECT dim_1 SUM(meas1) FROM facts WHERE dim_2 < `02-01-1995'
GROUP BY dim_1SELECT
SUBSTR( lpad(' ',2*(level-1)) ||
decode(id, 0, statement_id, operation) ||
' ' || options || ' ' || object_name ||
' ('|| cardinality|| ',' || bytes ||
' ,'|| cost || ')' || other_tag ,
1, 79) "step (card,bytes,cost) par"
from plan_table
start with id = 0
connect by prior id = parent_id
and prior nvl(statement_id,' ') =
nvl(statement_id,' ');Jan_Summary (32921, 5695333, 7309)
SORT GROUP BY (,,) PARALLEL_TO_SERIAL
VIEW facts (834569, 134008732, 6360) PARALLEL_TO_PARALLEL
UNION-ALL PARTITION (,,) PARALLEL_COMBINED_WITH_PARENT
TABLE ACCESS FULL fact_1 (815044,119570335, 6000) PARALLEL_COMBINED_WITH_PARENT
FILTER (,,) PARALLEL_COMBINED_WITH_PARENT
TABLE ACCESS FULL fact_2 (,,) PARALLEL_COMBINED_WITH_PARENT
. . .
FILTER (,,) PARALLEL_COMBINED_WITH_PARENT
TABLE ACCESS FULL fact_12 (,,) PARALLEL_COMBINED_WITH_PARENT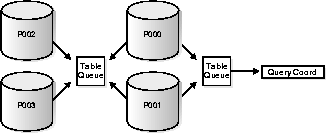
Data Redistribution among Parallel Query Servers
As a rule, if the PARALLEL_TO_PARALLEL keyword exists, there will be two sets of query servers. This means that for grouping, sort merge, or hash joins, twice the number of parallel query servers will be assigned to the query. This requires redistribution of data or rows from set 1 to set 2. If there is no PARALLEL_TO__TO_PARALLEL keyword, then the query will get just one set of servers. Such serial processes include aggregations, such as COUNT * FROM facts or SELECT facts WHERE DATE = '7/1/94'.
The file numbers listed in V$FILESTAT can be joined to those in the DBA_DATA_FILES view to group I/O by tablespace or to find the file name for a given file number. By doing ratio analysis you can find what percentage of the total tablespace activity for each file in the tablespace If you make a practice of putting just one large, heavily accessed object in a tablespace, you can use this technique to identify objects that have a poor physical layout.
You can further diagnose disk space allocation problems using the DBA_EXTENTS view. Ensure that space is allocated evenly from all files in the tablespace. Monitoring V$FILESTAT during a long running operation and correlating I/O activity to the explain plan output is a good way to follow progress.
This view can help you determine the appropriate number of query server processes for an instance. The statistics that are particularly useful are "Servers Busy", "Servers Idle", "Servers Started", and "Servers Shutdown".
Periodically examine V$PQ_SYSSTAT to determine if the query servers for the instance are actually busy. To determine whether the instance's query servers are active, issue the following query:
SELECT * FROM V$PQ_SYSSTAT
	WHERE statistic = "Servers Busy";
STATISTIC             VALUE
--------------------- -----------
Servers Busy          70
The view contains a row for each query server process that reads or writes each table queue. A table queue connecting 10 consumers to 10 producers will have 20 rows in the view. Sum the bytes column and group by TQ_ID for the total number of bytes sent through each table queue. Compare this with the optimizer estimates; large variations may indicate a need to analyze the data using a larger sample.
Compute the variance of bytes grouped by TQ_ID. Large variances indicate workload imbalance. Drill down on large variances to determine if the producers start out with unequal distributions of data, or whether the distribution itself is skewed. The latter may indicate a low number of distinct values.
For many of the dynamic performance tables, the system parameter TIMED_STATISTICS must be set to TRUE in order to get the most useful information. You can use ALTER SYSTEM to turn TIMED_STATISTICS on and off dynamically.
See Also: For more information, see Chapter 19, "The Dynamic Performance Tables".
Typically it is harder to map OS information about I/O devices and semaphore operations back to database objects and operations; on the other hand the OS may have better visualization tools and more efficient means of collecting the data.
OS information about CPU and memory usage is very important for assessing performance. Probably the most important statistic is CPU usage. The goal of low level performance tuning is to become CPU bound on all CPUs. Once this is achieved, you can pop up a level and work at the SQL level to find an alternate plan that is perhaps more I/O intensive but uses less CPU.
OS memory and paging information is valuable for fine tuning the many system parameters that control how memory is divided among memory-hungry warehouse subsystems like parallel communication, sort, and hash join.
Note: The default degree of parallelism is used for tables that have PARALLEL attributed to them in the data dictionary, or via the PARALLEL hint. If a table does not have parallelism attributed to it, or has NOPARALLEL (the default) attributed to it, then that table is never scanned in parallel--regardless of the default degree of parallelism that would be indicated by the number of CPUs, instances, and devices storing that table.
To override the default degree of parallelism:
By making the following changes you can increase the optimizer's ability to generate parallel plans:
SELECT COUNT(DISTINCT C) FROM T
to
SELECT COUNT(*)FROM (SELECT DISTINCT C FROM T)
To avoid I/O bottlenecks, specify a tablespace with at least as many devices as CPUs. To avoid fragmentation in allocating space, the number of files in a tablespace should be a multiple of the number of CPUs.
CREATE TABLE summary PARALLEL UNRECOVERABLE
	AS SELECT dim_1, dim_2 ..., SUM (meas_1) FROM facts
GROUP BY dim_1, dim_2;
You can take advantage of intermediate tables using the following techniques:
Parallel index creation works in much the same way as a table scan with an ORDER BY clause. The table is randomly sampled and a set of index keys is found that equally divides the index into the same number of pieces as the degree of parallelism. A first set of query processes scans the table, extracts key,rowid pairs, and sends each pair to a process in a second set of query processes based on key. Each process in the second set sorts the keys and builds an index in the usual fashion. After all index pieces are built, the coordinator simply concatenates the pieces (which are ordered) to form the final index. .
You can optionally specify that no redo logging should occur during index creation. This can significantly improve performance, but temporarily renders the index unrecoverable. Recoverability is restored after the new index is backed up. If your application can tolerate this window where recovery of the index requires it to be recreated, then you should consider using the UNRECOVERABLE option.
By default, the Oracle Server uses the table definition's PARALLEL clause value to determine the number of server processes to use when creating an index. You can override the default number of processes by using the PARALLEL clause in the CREATE INDEX command.
Attention: When creating an index in parallel, the STORAGE clause refers to the storage of each of the subindexes created by the query server processes. Therefore, an index created with an INITIAL of 5MB and a PARALLEL DEGREE of 12 consumes at least 60MB of storage during index creation because each process starts with an extent of 5MB. When the query coordinator process combines the sorted subindexes, some of the extents may be trimmed, and the resulting index may be smaller than the requested 60MB.
When you add or enable a UNIQUE key or PRIMARY KEY constraint on a table, you cannot automatically create the required index in parallel. Instead, manually create an index on the desired columns using the CREATE INDEX command and an appropriate PARALLEL clause and then add or enable the constraint. Oracle then uses the existing index when enabling or adding the constraint.
See Also: For more information on how extents are allocated when using the parallel query feature, Oracle7 Server Concepts.
Refer to the Oracle7 Server SQL Reference for the complete syntax of the CREATE INDEX command.
Attention: You must use ANALYZE to gather current statistics for cost-based optimization. In particular, tables used in parallel should always be analyzed.
Use discretion in employing hints. With the parallel aware optimizer cost-based optimization generates such good plans that hints should rarely be necessary. If used at all, hints should come as a final step in tuning, and only when they demonstrate a necessary and significant performance advantage. In such cases, begin with the execution plan recommended by cost-based optimization, and only go on to test the effect of hints after you have quantified your performance expectations.
Remember that hints are powerful; if you use them and the underlying data changes you may need to change the hints. Otherwise, the effectiveness of your execution plans may deteriorate.
Always use cost-based optimization unless you have an existing application that has been hand-tuned for rule-based optimization. If you must use rule-based optimization, rewriting a SQL statement can give orders of magnitude improvements.
See Also: "OPTIMIZER_PERCENT_PARALLEL" on page 18-5. This parameter controls parallel awareness.
|
Prev Next |
Copyright © 1996 Oracle Corporation. All Rights Reserved. |
Library |
Product |
Contents |
Index |