| Oracle7 Server Tuning | Library |
Product |
Contents |
Index |
| Oracle7 Server Tuning | Library |
Product |
Contents |
Index |
Tuning I/O can help performance if a disk containing database files is operating at its capacity. However, tuning I/O cannot help performance in "CPU bound" cases, or cases in which your computer's CPUs are operating at their capacity.
It is important to tune I/O after following the recommendations presented in Chapter 13, "Tuning Memory Allocation". That chapter explains how to allocate memory so as to reduce I/O to a minimum. After reaching this minimum, follow the instructions in the present chapter to perform the necessary I/O as efficiently as possible.
For an existing system, you should approach I/O tuning from the bottom up:
In an OLTP application, for example, each transaction might involve:
Disk Speed: |
File System |
Raw Devices |
|
Reads per second
|
fast
|
slow
|
|
Writes per second
|
slow
|
fast
|
Lay out in a table like the following the relative speed per operation of your disks:
Disk Speed: |
File System |
Raw Devices |
|
Reads per second
|
|
|
|
Writes per second
|
|
|
The disks in this example have the following characteristics:
Disk Speed: |
File System |
Raw Devices |
|
Reads per second
|
50
|
45
|
|
Writes per second
|
20
|
50
|
Object
If Stored on File System
If Stored on Raw Devices
R/W
Needed per
Sec.
Disk R/W
Capabil.
per Sec.
Disks
Needed
R/W
Needed per
Sec.
Disk R/W
Capabil.
per Sec.
Disks
Needed
A
B
C
Disks Req'd
Operation |
Process |
|||||||
LGWR |
DBWR |
ARCH |
SMON |
PMON |
CKPT |
Fore- ground |
PQ Slave |
|
|
Sequential Read
|
|
|
X
|
X
|
|
X
|
X
|
X
|
|
Sequential Write
|
X
|
|
X
|
|
|
X
|
|
|
|
Random Read
|
|
|
|
X
|
|
|
X
|
|
|
Random Write
|
|
X
|
|
|
|
|
|
|
Attention: The figures provided in this example do not constitute a rule of thumb. They were generated by a given UNIX-based test system using particular disks. These figures will differ significantly for different platforms and different disks! To make accurate judgments, you must test your own system using an approach like the one demonstrated in this section. Alternatively, contact your system vendor for information on relative disk performance for the different operations.
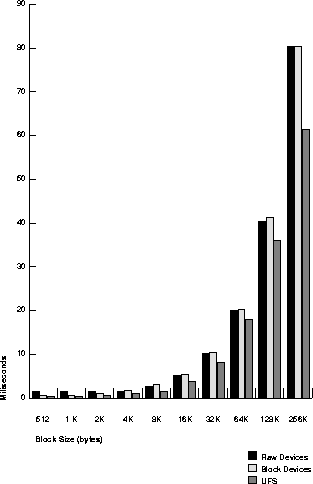
The following table and graph show speed of sequential read in milliseconds per I/O, for each of the three disk layout options on a test system.
Doing research like this helps you pick the right stripe size. In this example, if the data is striped over 16 disks at a stripe size of 16K, you can read in chunks of 256K, and the average time to read would be 5 to 10 milliseconds. By contrast, if all the data were on one disk, read time would be 80 milliseconds. Thus the test results show that on this particular set of disks, things look quite different from what might be expected: it is sometimes beneficial to have a smaller stripe size, depending on the size of the I/O.

Block Size and Speed of Sequential Read (Sample Data)
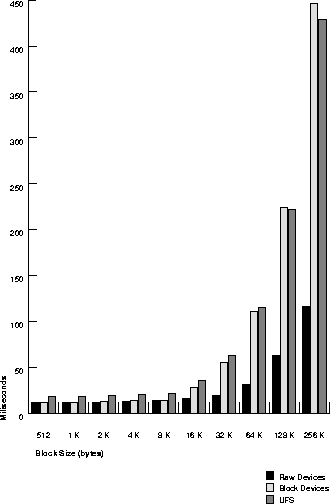
The following table and graph show speed of sequential write in milliseconds per I/O, for each of the three disk layout options on the test system.
.

Block Size and Speed of Sequential Write (Sample Data)
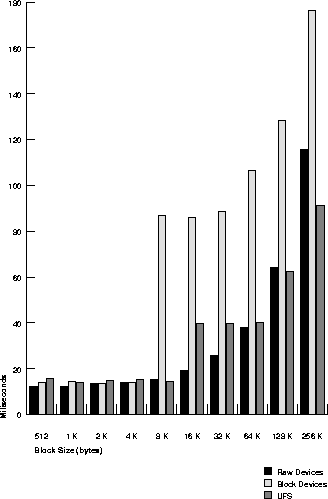
The following table and graph show speed of random read in milliseconds per I/O, for each of the three disk layout options on the test system.

Block Size and Speed of Random Read (Sample Data)
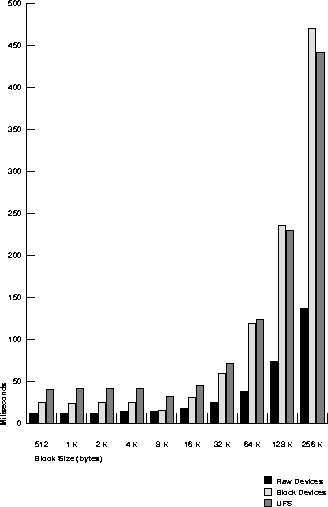
The following table and graph show speed of random write in milliseconds per I/O, for each of the three disk layout options on the test system.

Block Size and Speed of Random Write (Sample Data)
For example, with the sample application and test system described previously, the UNIX file system would be a good choice. With random reads predominating (50% of all I/O operations), 8K would be a good block size. Raw devices and UNIX file system provide comparable performance of random reads at this block size. Furthermore, the UNIX file system in this example processes sequential reads almost twice as fast as raw devices, given an 8K block size.
Attention: Figures shown in the preceding example will differ significantly on different platforms, and with different disks! To plan effectively you must test I/O performance on your own system!
The operating system I/O size should be equal to or greater than the database block size. Sequential read performance will improve if operating system I/O size is twice or three times the database block size (as in the example in "Testing Performance of Your Disks"). This assumes that the operating system can buffer the I/O so that the next block will be read from that particular buffer.
The following figure illustrates the suitability of various block sizes to online transaction processing or decision support applications.

Block Size and Application Type
See Also: Your Oracle platform-specific documentation for information on the minimum and maximum block size on your platform.
Oracle compiles file I/O statistics that reflect disk access to database files. Note, however, that these statistics only report the I/O utilization of Oracle sessions--yet every process running on your system affects the available I/O resources. Tuning non-Oracle factors can thus result in better Oracle performance.
Tools such as sar -d on many UNIX systems enable you to examine the iostat I/O statistics for your entire system. (Some UNIX-based platforms have an iostat command.) On NT systems, use Performance Monitor.
Attention: For information on other platforms, please check your operating system documentation.
See Also: Oracle platform-specific documentation.
File |
Process |
|||||||
LGWR |
DBWR |
ARCH |
SMON |
PMON |
CKPT |
Fore- ground |
PQ Slave |
|
|
Database Files
|
|
X
|
|
X
|
X
|
X
|
X
|
X
|
|
Log Files
|
X
|
|
|
|
|
|
|
|
|
Archive Files
|
|
|
X
|
|
|
|
|
|
|
Control Files
|
X
|
X
|
X
|
X
|
X
|
X
|
X
|
X
|
V$SYSTEM_EVENT, for example, shows the total number of I/Os and average duration, by type of I/O. In this way you can determine which types of I/O are too slow.
|
PHYRDS
|
The value of this column is the number of reads from each database file.
|
|
PHYWRTS
|
The value of this column is the number of writes to each database file.
|
Use the following query to monitor these values over some period of time while your application is running:
SELECT name, phyrds, phywrts
   FROM v$datafile df, v$filestat fs
WHERE df.file# = fs.file#;NAME PHYRDS PHYWRTS
-------------------------------------------- ---------- ----------
/oracle/ora70/dbs/ora_system.dbf 7679 2735
/oracle/ora70/dbs/ora_temp.dbf 32 546
In general, consider the statistics in the V$FILESTAT table and your operating system facilities. Consult your hardware documentation to determine the limits on the capacity of your disks. Any disks operating at or near full capacity are potential sites for disk contention. For example, 40 or more I/Os per second is excessive for most disks on VMS or UNIX operating systems.
To reduce the activity on an overloaded disk, move one or more of its heavily accessed files to a less active disk. Apply this principle to each of your disks until they all have roughly the same amount of I/O. This is referred to as distributing I/O.
Place each set of redo log files on a separate disk with no other activity. Redo log files are written by the Log Writer process (LGWR) when a transaction is committed. Information in a redo log file is written sequentially. This sequential writing can take place much faster if there is no concurrent activity on the same disk.
Dedicating a separate disk to redo log files usually ensures that LGWR runs smoothly with no further tuning attention. Performance bottlenecks related to LGWR are rare. For information on tuning LGWR, see the section "Detecting Contention for Redo Log Buffer Latches" on page 16-13.
Note: Mirroring redo log files, or maintaining multiple copies of each redo log file on separate disks, does not slow LGWR considerably. LGWR writes to each disk in parallel and waits until each part of the parallel write is complete. Since the time required for your operating system to perform a single-disk write may vary, increasing the number of copies increases the likelihood that one of the single-disk writes in the parallel write will take longer than average. A parallel write will not take longer than the longest possible single-disk write. There may also be some overhead associated with parallel writes on your operating system.
If I/O queues exist or are suspected, then load distribution across the available devices is a natural tuning step. Where larger numbers of physical drives are available, consider dedicating two drives to carrying redo logs (two because redo logs should always be mirrored either by the operating system or using Oracle redo log group features). Since redo logs are written serially, any drive dedicated to redo log activity will normally require very little head movement. This will significantly speed up log writing.
If archiving, it is beneficial to use extra disks so that LGWR and ARCH do not compete for the same read/write head. This is achieved by placing logs on alternating drives.
Note that mirroring can also be a cause of I/O bottlenecks. The process of writing to each mirror is normally done in parallel, and does not cause a bottleneck. However, if each mirror is striped differently, then the I/O is not completed until the slowest member is finished. To avoid I/O problems, striping should be done on the same number of disks as the data itself.
For example, if you have 160K of data striped over 8 disks, but the data is mirrored onto only one disk, then regardless of how quickly the data is processed on the 8 disks, the I/O is not completed until 160K has been written onto the mirror disk. It might thus take 20.48 milliseconds to write the database, but 137 milliseconds to write the mirror.
			CREATE TABLESPACE stripedtabspace
			   DATAFILE 'file_on_disk_1' SIZE 1GB,
			      'file_on_disk_2' SIZE 1GB,
			      'file_on_disk_3' SIZE 1GB,
			      'file_on_disk_4' SIZE 1GB,
			      'file_on_disk_5' SIZE 1GB;
			CREATE TABLE stripedtab (
			   col_1  NUMBER(2),
			   col_2  VARCHAR2(10) )
			   TABLESPACE stripedtabspace
			   STORAGE ( INITIAL 1023MB  NEXT 1023MB
			      MINEXTENTS 5  PCTINCREASE 0 );
See Also: Oracle7 Server SQL Reference Guide for more information on MINEXTENTS and the other storage parameters.
With striping software, the biggest concern is choosing the right stripe size. This depends on Oracle block size and type of disk access.
In striping, uniform access to the data is assumed. If the stripe size is too big you can end up with a hot spot on one disk or on a small number of disks. You can avoid this problem by making the stripe size smaller, thus spreading the data over more disks.
In some instances, performance can be improved by not using the full features of RAID technology. In other cases, RAID technology's resilience to single component failure may justify its cost in terms of performance.
SELECT name, value
   FROM v$sysstat
   WHERE name = 'recursive calls';
The output of this query might look like this:
NAME                                                         VALUE
------------------------------------------------------- ----------
recursive calls                                             626681
If Oracle continues to make excessive recursive calls while your application is running, determine whether these recursive calls are due to one of the activities that generate recursive calls other than dynamic extension. If you determine that these recursive calls are caused by dynamic extension, you should try to reduce this extension by allocating larger extents.
Automatically resizable datafiles can also cause a problem with dynamic extension. Avoid using the automatic extension. Instead, manually allocate more space to a datafile during times when the system is relatively inactive.
Extent maps list all the extents for a certain segment. The number of extents per block depends on block size and platform. Although an extent is a data structure inside Oracle, the size of this data structure depends on the operating system. Accordingly, this affects the number of extents which can be stored in a single block. Typically, this value is as follows:
Block Size |
Max. Number of Extents |
|
2
|
121
|
|
4
|
255
|
|
8
|
504
|
|
16
|
1032
|
|
32
|
2070
|
For best performance, you should be able to read the extent map with a single I/O. Performance will degrade if multiple I/Os are necessary for a full table scan to get the extent map.
Use the SET TRANSACTION command to assign transactions to rollback segments of the appropriate size based on the recommendations in the following sections. If you do not explicitly assign a rollback segment to a transaction, Oracle randomly chooses a rollback segment for it.
Warning: If you are running multiple concurrent copies of the same application, be careful not to assign the transactions for all copies to the same rollback segment. This leads to contention for that rollback segment.
Also monitor the shrinking, or dynamic deallocation, of rollback segments based on the OPTIMAL storage parameter. For information on choosing values for this parameter and monitoring rollback segment shrinking, and adjusting OPTIMAL accordingly, see the Oracle7 Server Administrator's Guide.
Example: This statement assigns the current transaction to the rollback segment OLTP_13:
SET TRANSACTION USE ROLLBACK SEGMENT oltp_13
Dynamic space management, especially migration and chaining, is detrimental to performance:
To reduce migrated and chained rows in an existing table, follow these steps:
ANALYZE TABLE order_hist LIST CHAINED ROWS;
			SELECT *
			   FROM chained_rows
			   WHERE table_name = 'ORDER_HIST';

			OWNER_NAME  TABLE_NAME  CLUST... HEAD_ROWID          TIMESTAMP
			----------  ----------  -----... ------------------  ---------
			SCOTT       ORDER_HIST       ... 0000186A.0003.0001  04-AUG-92
			SCOTT       ORDER_HIST       ... 0000186A.0002.0001  04-AUG-92
			SCOTT       ORDER_HIST       ... 0000186A.0001.0001  04-AUG-92
					CREATE TABLE int_order_hist
					   AS SELECT *
					      FROM order_hist
					      WHERE ROWID IN
					         (SELECT head_rowid
					            FROM chained_rows
					            WHERE table_name = 'ORDER_HIST');
					DELETE FROM order_hist
					   WHERE ROWID IN
					      (SELECT head_rowid
					         FROM chained_rows
					         WHERE table_name = 'ORDER_HIST');
					INSERT INTO order_hist
					   SELECT *
					      FROM int_order_hist;
DROP TABLE int_order_history;
			DELETE FROM chained_rows
		   WHERE table_name = 'ORDER_HIST';
Set PCTFREE to avoid migrated rows. If you leave more free space available in the block, the row will have room to grow. You can detect migrated rows by checking the "table fetch continued row" statistic in V$SYSSTAT. You can also reorganize (recreate) tables and indexes with high deletion rate.
Note: PCTUSED is not the opposite of PCTFREE; it concerns space management.
See Also: Oracle7 Server SQL Reference for complete information about these parameters.
See Also: Oracle7 Server Concepts for a list of SQL statements that perform sorts.
Use the following query to monitor these statistics over a period of time while your application is running:
SELECT name, value
   FROM v$sysstat
WHERE name IN ('sorts(memory)', 'sorts(disk)');NAME VALUE
------------------------------------------------------- ----------
sorts(memory) 965
sorts(disk) 8
If a significant number of sorts require disk I/O to temporary segments, then your application's performance may benefit from increasing the size of the sort area. In this case, increase the value of the initialization parameter SORT_AREA_SIZE. The maximum value of this parameter varies depending on your operating system. You need to determine how large a SORT_AREA_SIZE makes sense. If it is big enough, most sorts should not go to disk (unless, for example, you are sorting a 10 Gigabyte table). If the sort does not go to disk, you have the option of writing or not writing to the buffer cache.
See Also: "Optimizing Large Sorts with SORT_DIRECT_WRITES" on page 14-39
If you increase the size of your sort area, you may consider decreasing the retained size of the sort area, or the size to which Oracle reduces the sort area if its data is not expected to be referenced soon. To decrease the retained size of the sort area, decrease the value of the initialization parameter SORT_AREA_RETAINED_SIZE. A smaller retained sort area reduces memory usage but causes additional I/O to write and read data to and from temporary segments on disk.
To specify a tablespace as temporary, use the TEMPORARY keyword of the CREATE TABLE or ALTER TABLE commands. TEMPORARY cannot be used with tablespaces that contain permanent objects (such as tables or rollback segments).
The temporary tablespace should be striped over many disks, preferably with some operating system striping tool. For example, if the temporary tablespace is only striped over 2 disks with a maximum of 50 I/Os per second each, then you can only do 100 I/Os per second. This restriction could become a problem, making sort operations take a very long time.
You could speed up sorts fivefold if you were to stripe the temporary tablespace over 10 disks. This would enable 500 I/Os per second.
Change the SORT_READ_FAC parameter, which is a ratio that describes the amount of time necessary to read a single database block divided by the block transfer rate. The value is operating system specific; the default value is typically 5, but the parameter should usually be set to 16 or 32. This allows the system to read more blocks per pass from a temporary table. For temporary tables, SORT_READ_FAC plays a role similar to the parameter DB_FILE_MULTIBLOCK_READ_COUNT.
See Also: Oracle7 Server SQL Reference for more information about the syntax of the CREATE TABLE and ALTER TABLE commands.
When you create the index, use the NOSORT option on the CREATE INDEX command. For example, this CREATE INDEX statement creates the index EMP_INDEX on the ENAME column of the EMP table without sorting the rows in the EMP table:
CREATE INDEX emp_index
   ON emp(ename)
   NOSORT;
Note: Specifying NOSORT in a CREATE INDEX statement negates the use of PARALLEL INDEX CREATE, even if PARALLEL (DEGREE n) is specified.
On the other hand, if you have a single-CPU computer, you should sort your data before loading, if possible. Then create the index with the NOSORT option.
You must set the V733_PLANS_ENABLED initialization parameter to TRUE for GROUP BY NOSORT to be available.
The default value of SORT_DIRECT_WRITES is AUTO. When the parameter is unspecified or set to AUTO, Oracle automatically allocates direct write buffers if the SORT_AREA_SIZE is at least ten times the minimum direct write buffer configuration.
The memory for the direct write buffers is subtracted from the sort area, so the total amount of memory used for each sort is still SORT_AREA_SIZE. Setting SORT_WRITE_BUFFERS and SORT_WRITE_BUFFER_SIZE has no effect when SORT_DIRECT_WRITES is AUTO.
The minimum direct write configuration on most platforms is two 32K buffers (2 * 32K), so direct write is generally allocated only if the sort area is 640K or greater. With a sort area smaller than this, direct write will not be performed.
Ensure that your operating system has enough free memory available to accommodate this increase. Also, sorts that use direct writes will tend to consume more temporary segment space on disk.
One way to avoid increasing memory usage is to decrease the sort area by the amount of memory allocated for direct writes. Note that reducing the sort area may increase the number of sorts to disk, which will decrease overall performance. A good rule of thumb is that the total memory allocated for direct write buffers should be less than one-tenth of the memory allocated for the sort area. If the minimum configuration of the direct write buffers is greater than one-tenth of your sort area, then you should not trade sort area for direct write buffers.
However, a checkpoint can momentarily reduce runtime performance for these reasons:
Because checkpoints on log switches are necessary for redo log maintenance, you cannot eliminate checkpoints entirely. However, you can reduce checkpoint frequency to a minimum by setting these parameters:
You can further reduce checkpoints by reducing the frequency of log switches. To reduce log switches, increase the size of your redo log files so that the files do not fill as quickly.
CKPT updates datafile headers when a checkpoint occurs, leaving LGWR free to write redo entries. To enable CKPT, set the value of the initialization parameter CHECKPOINT_PROCESS to TRUE. To disable CKPT, set this value to FALSE. CKPT is disabled by default. Before enabling CKPT, be sure that your operating system can support an additional process. You may also need to increase the value of the initialization parameter PROCESSES.
Note that only current or consistent read blocks are checkpointed. By contrast, sort blocks are not checkpointed.
To reduce the performance impact of checkpoints, make sure that DBWR writes enough during periods of normal (non-peak) activity. DBWR activity sometimes has a pattern of sharp peaks and valleys. If DBWR is tuned to be more aggressive in writing, then the average level of its activity will be raised, and it will not fall behind.
DB_BLOCK_CHECKPOINT_BATCH specifies the number of blocks the DBWR process must write out as part of a checkpoint. If the internal Oracle write batch size is 512 buffers, and 8 of those are required for a checkpoint, then the checkpoint may take a very long time. Because you only write 8 blocks a t a time, the start and end of a checkpoint will take a long time, going through 512 buffers, 8 at a time.
If the average size of the I/O becomes quite large, the log file could become a bottleneck. To avoid this problem, you can stripe the redo log files, going in parallel to several disks. You must use an operating system striping tool, because manual striping is not possible in this situation.
Stripe size is likewise important. You can figure an appropriate value by dividing the average redo I/O size by the number of disks over which you want to stripe the buffer.
If you have a large number of datafiles or are in a high OLTP environment, you should always have the CKPT initialization parameter set to TRUE. Using the CKPT process ensures that during a checkpoint LGWR keeps on writing redo information, while CKPT updates the datafile headers.

For best results, take the following approach:
|
Prev Next |
Copyright © 1996 Oracle Corporation. All Rights Reserved. |
Library |
Product |
Contents |
Index |