| Oracle Enterprise Manager Performance Monitoring User's Guide | Library |
Product |
Contents |
Index |
| Oracle Enterprise Manager Performance Monitoring User's Guide | Library |
Product |
Contents |
Index |
Defining a New Chart
You can define new SQL charts.
The SQL Statement page contains the following:
For example, if you were to define a chart similar to the predefined chart named File I/O Rate, you might want to select the option FILE I/O RATE DETAILS from the Drilldown combo box. The predefined chart File I/O Rate Details would then be displayed when the user drills down from the chart you are defining.
For example, if you were to define a chart similar to the predefined chart named File I/O Rate, you might want to select the option TOPSESSIONS - FILE I/O from the Drilldown combo box. The Oracle TopSessions main window would then be displayed when the user drills down from the chart you are defining. By choosing Refresh from the Oracle TopSessions Sessions menu, the user would display the top x sessions sorted by the File I/O sort statistic.
SQL Statement
Enter in this box the SQL statement that will be used to gather statistics to be displayed in the chart you are defining. Make sure that the SQL statement does not end with a semicolon (;). Execute
Click on this button to execute the SQL statement you have entered in the SQL Statement box, and display its result in the Result box. Result
After you click on the Execute button, this box displays the result of the SQL statement you entered in the SQL Statement box. If the SQL statement returns an error, the title bar of the Result box displays the error. If the SQL statement is correct but returns no data, the title bar of the Result box indicates that no data is available. You must enter a valid SQL statement that returns data in order to create a chart. Apply
Disabled. OK
Click on this button to apply the chart definitions you have specified, exit the property sheet, and display the new chart you have just defined. The chart is automatically displayed within a chart window with the same title (name) as the chart itself. (If you then want to modify the chart, choose Modify Chart from the Modify menu.) Cancel
Click on this button to cancel the chart definitions you have specified and exit the property sheet. Display Options Page
Use the Display Options page of the New SQL Chart property sheet to customize how the resulting data from the SQL statement entered on the SQL Statement page will be displayed in chart form. The Display Options page contains the following: Label
Enter text in this box to label a variable you are presenting as a column in your chart. Simple
Click this button (default) to indicate that the chart will display a simple query against a table or view, or a calculation on a simple query against a table or view. A simple function f(a) contrasts with a complex function f(a) operation f(b), where operation is one of the operations of the Operations combo box. Complex
Click this button to perform a more complex operation on two queried values from a table or view. A complex function takes the form f(a) operation f(b), where operation is one of the operations of the Operation combo box. This complex function contrasts with a simple function f(a), as selected using the Simple button. Function
Click this first Function combo box to select the type of function to be used on one or more retrieved values from a table or view. Column
Click on this first Column combo box to select which variable will be represented in a column of the chart. This box contains column names from the result of the SQL statement you entered in the SQL Statement box. Add
Click on this button to add the column(s) you have defined to the chart, and display these definitions in the Selections to Display box on this page. Operation
Click on this second Operation combo box to select the operation to perform on two variables to produce data for a column in a complex chart. Function
Click on this second Function combo box to select the type of function to be used on the second operand to produce data for a column in a complex chart. Column
Click on this second Column combo box to select the second variable on which the operation is to be performed to produce data for a column in a complex chart. This second Column combo box is enabled only when the Complex button has been selected. Selections to Display
This box displays the label/function mapping defined for each columnname of the chart. Delete
Click on this button to delete the selected column from the Selections to Display box. The chart you are defining will not display the column you have just removed. Clear All
Clears all entries in the Selections to Display field, so that you can enter a new label/function mapping for each columnname of the chart. Row Label
Click on this combo box to specify a column from which data will be used to label the rows of the chart. The default is <none>. Chart Type
Click on this combo box to select the chart type for the chart you are defining.
Transpose Chart Axes
Click on the No button (default) of this button group to accept the default mapping of variables in your SQL statement as columns in the chart. Apply
Disabled. OK
Click on this button to apply the chart definitions you have specified on pages of the New SQL Chart property sheet, exit the property sheet, and display the new chart you have just defined. (If you then want to modify the chart, choose Modify SQL Chart from the Charts menu.) Cancel
Click on this button to cancel the chart definitions you have specified on both pages of the New SQL Chart property sheet and exit the property sheet. Example of Defining a New Chart
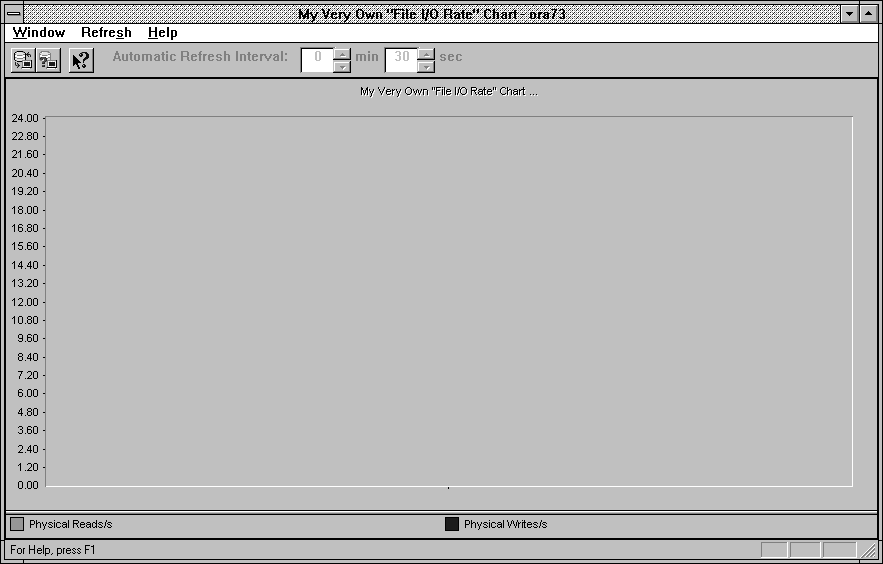
This section illustrates how you would define a simple chart with two additional features: transposed axes and drilldown capability. This section explains the steps you would take if you were to define a chart similar to the predefined chart File I/O Rate.
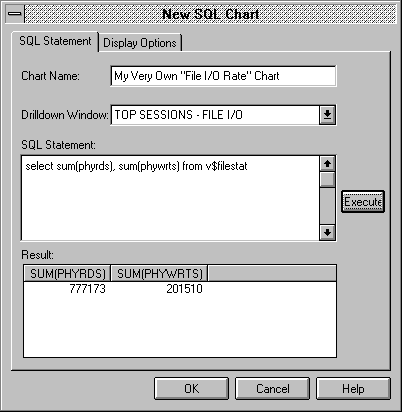
Figure 5-1: SQL Statement Page for a New Chart
As Figure 5-1 suggests, to define this chart you would complete the SQL Statement page as follows: 
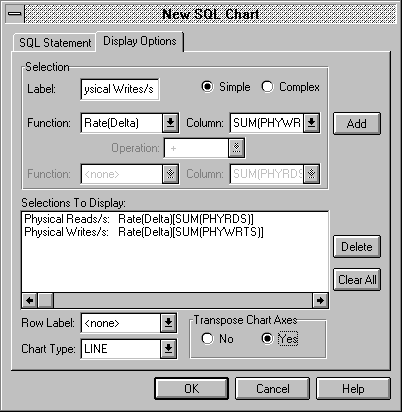
Figure 5-2: Display Options Page for a New Chart
As Figure 5-2 suggests, to define this chart you would complete the Display Options page as follows: 
Figure 5-3: Example of a Simple Chart with Transposed Axes

Modifying the Basic Definition of a User-defined SQL Chart
To modify the basic definition of an existing user-defined SQL chart, it is best to display the chart, as described in Displaying Charts in Chart Windows on page 6-1, and then choose Modify SQL Chart from the Charts menu.
The resulting Modify SQL Chart property sheet is virtually identical to the New SQL Chart property sheet described in a previous section, "Defining a New Chart," but for the following exception:
Chart Name
On the Modify SQL Chart property sheet, Chart Name is a combo box from which you select the existing user-defined chart whose basic definition you want to modify. Modifying the Basic Definition of a Predefined Chart
In the initial release of the Oracle Performance Manager, only user-defined charts can be modified using the Modify Chart property sheet, as described in the previous section. If you want to create a modified version of a predefined chart, you can perform the following steps:
|
Prev Next |
Copyright © 1996 Oracle Corporation. All Rights Reserved. |
Library |
Product |
Contents |
Index |