| Oracle7 Server Tuning | Library |
Product |
Contents |
Index |
| Oracle7 Server Tuning | Library |
Product |
Contents |
Index |
For example, the following figure illustrates workload over time for an application which has peak periods at 10:00 AM and 2:00 PM.
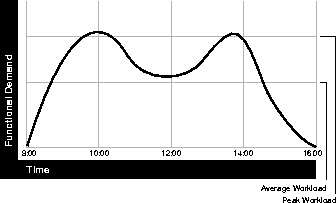
However, usage patterns form peaks and valleys--and in this context 20 transactions per minute can be understood as merely a minimum requirement. If the peak rate you need to achieve is 120 transactions per minute, then you must configure a system which can support this peak workload.
For this example, assume that at peak workload Oracle can use 90% of the CPU resource. For a period of average workload, then, Oracle should be using no more than about 15% of the available CPU resource.
15% = 20 tpm/120 tpm * 90%
If the system requires 50% of the CPU resource to achieve 20 transactions per minute, then it is clear that a problem exists: the system cannot possibly achieve 120 transactions per minute using 90% of the CPU. If you were to tune this system such that it does achieve 20 transactions per minute using only 15% of the CPU, then (assuming linear scalability) the system might indeed attain 120 transactions per minute using 90% of the CPU.
Note that as users are added to an application over time, the average workload can rise up to what had been peak levels. Then there is no CPU capacity available for the new peak rate, which is actually higher than before.
Use operating system monitoring tools to see what processes are running on the system as a whole. If the system is too heavily loaded, check the memory, I/O, and process management areas described later in this section.
Tools such as sar -u on many UNIX-based systems enable you to examine the level of CPU utilization on your entire system. CPU utilization in UNIX is described in statistics that show user time, system time, idle time, time waiting for I/O. You have a CPU problem if idle time and time waiting for I/O are both close to zero (less than 5%) at a normal or low workload.
Performance Monitor is used on NT systems to examine CPU utilization. It provides statistics on processor time, user time, privileged time, interrupt time, and DPC time. (Note that Performance Monitor is not to be confused with Performance Manager, which is an Oracle Enterprise Manager tool.)
Attention: This section describes how to check system CPU utilization on most UNIX-based systems. For non-UNIX platforms, please check your operating system documentation.
Paging and Swapping. Use the appropriate tools (such as sar or vmstat on UNIX or Performance Monitor on NT) to investigate the cause of paging and swapping, should they occur.
Thrashing. Make sure that your workloads will fit in memory, so that the machine is not thrashing (swapping and paging processes in and out of memory). The operating system allocates fixed slices of time during which CPU resources are available to your process. If the process squanders a large portion of each time slice checking to be sure that it can run, that all needed components are in the machine, it may be using only 50% of the time allotted to actually perform work.
Often people create processes on the fly, to do one thing. Then they exit the process, and create a new one such that the process is recreated and destroyed all the time. This is very CPU-intensive, especially with large SGAs. With large SGAs, creating processes on the fly becomes expensive because you have to build up the page tables. This is particularly expensive when you nail or lock shared memory: then you have to touch every page.
For example, if you have a 1 gigabyte SGA, you may have page table entries for every 4K, and a page table entry may be 8 bytes. You could end up with 1G * 4K * 8B entries. This becomes expensive, because you have to continually make sure that the page table is loaded.
Parallel query and multi-threaded server are areas of concern here, where MINSERVICE has been set too low (set to 10, for example, when you need 20).
For the user, doing small lookups may not be wise. In a situation like this, it becomes inefficient for the user and for the system as well.
V$SYSSTAT shows Oracle CPU usage for all sessions. The statistic "CPU used by this session" actually shows the aggregate CPU used by all sessions.
V$SESSTAT shows Oracle CPU usage per session. You can use this view to see which particular session is using the most CPU.
For example, if you have 8 CPUs, then for any given minute in real time, you have 8 minutes of CPU time available. On NT and UNIX-based systems this can be either user time or time in system mode ("privileged" mode, in NT). If your process is not running, it is waiting. CPU utilized by all systems may thus be greater than one minute per interval.
At any given moment you know how much time Oracle has utilized the system. So if 8 minutes are available and Oracle uses 4 minutes of that time, then you know that 50% of all CPU time is used by Oracle. If your process is not consuming that time, then some other process is. Go back to the system and find out what process is using up the CPU. Identify it, determine why it is using so much CPU, and see if you can tune it.
The major areas to check for Oracle CPU utilization are:
			SELECT * FROM V$SYSSTAT
			WHERE NAME IN
			('parse time cpu', 'parse time elapsed', 'parse count');
In interpreting these statistics, remember
			SELECT SQL_TEXT, PARSE_CALLS, EXECUTIONS FROM V$SQLAREA
			ORDER BY PARSE_CALLS;
SELECT BUFFER_GETS, EXECUTIONS, SQL_TEXT FROM V$SQLAREA;
The SQL statements with a high number of buffer gets may be inefficient. You may be able to reduce CPU usage by tuning these statements.

Normally you would expect to see 1 or 2 buffers scanned, on average. If more than this number are being scanned, you can increase the size of the buffer cache or tune the DBWR.
You can apply the following formula to find the number of buffers that were dirty at the end of the LRU.

If there are many dirty buffers, it could mean that the DBWR process cannot keep up. Again, increase buffer cache size or tune DBWR.
The spin count may be set too high. Some other process may be holding a latch which your process is attempting to get--and your process may be spinning and spinning in an effort to get the latch. After a while your process may go to sleep before waking up to repeat its ineffectual spinning.
|
Prev Next |
Copyright © 1996 Oracle Corporation. All Rights Reserved. |
Library |
Product |
Contents |
Index |